Introduction
We know that Logging is an essential part of monitoring and troubleshooting issues and any production errors or visualizing the data. Logging must be consistent and reliable so we can use that information for discovering relevant data. Although CloudHub (except titanium subscription) has a limitation of 100 MB of logs or 30 days of logs. For a robust logging mechanism, it is essential to have an external log analytic tool to further monitor the application.
Today we will be using elastic cloud as an external logging tool and integrating it with MuleSoft using Log4j2 HTTP appender to send mule application logs to Elastic cloud. Logging to Elastic cloud can be enabled on Cloud Hub and On-Premise.
What is the ELK Stack?
The ELK stack is offered by Elastic and is named after 3 open source components for ingesting, parsing, storing and visualising logs:
- Elasticsearch - This is the storage part of the stack responsible for storing and searching the logs. It operates in clusters so can be scaled horizontally with ease. Users interact with it over an API and it provides “lightning fast” search capabilities.
- Kibana - To navigate and visualise the log data stored in Elasticsearch which includes searching logs and creating charts, metrics and dashboards.
- Logstash - This is the tool that takes in logs, parses them and sends them into Elasticsearch. Just like an integration tool, it receives input, performs transformations/filters, and then sends the output to another system.
What is the Elastic Cloud?
Elastic Cloud is the best way to consume all of Elastic's products across any cloud. Easily deploy in your favorite public cloud, or in multiple clouds, and extend the value of Elastic with cloud-native features. Accelerate results that matter, securely and at scale.
- On-demand computing
- Pay only for what you use
- Failover and fault tolerance
- Common coding
- Ease of implementation
Procedures and WTs
Enable Logging For CloudHub Application
Before enabling the logging for CloudHub application, you need Disable CloudHub logs. By default, this option is not available and you need to raise a ticket with MuleSoft for providing this option.

Once you disabled CloudHub logs, MuleSoft is not responsible for below things
- MuleSoft is not responsible for lost logging data due to the misconfiguration of your log4j appender.
- MuleSoft is also not responsible for misconfigurations that result in performance degradation, running out of disk space, or other side effects.
- When you disable the default CloudHub application logs, then only the system logs are available. For application worker logs, please check your own application’s logging system. Downloading logs is not an option in this scenario.
- Only Asynchronous log appenders can be used, Synchronous appenders should not be used.
- Use asynchronous loggers and not synchronous ones is to avoid threading issues. Synchronous loggers can lock threads waiting for responses.
There are two ways you can send logs to ELK
- HTTP Appender
- Socket Appender
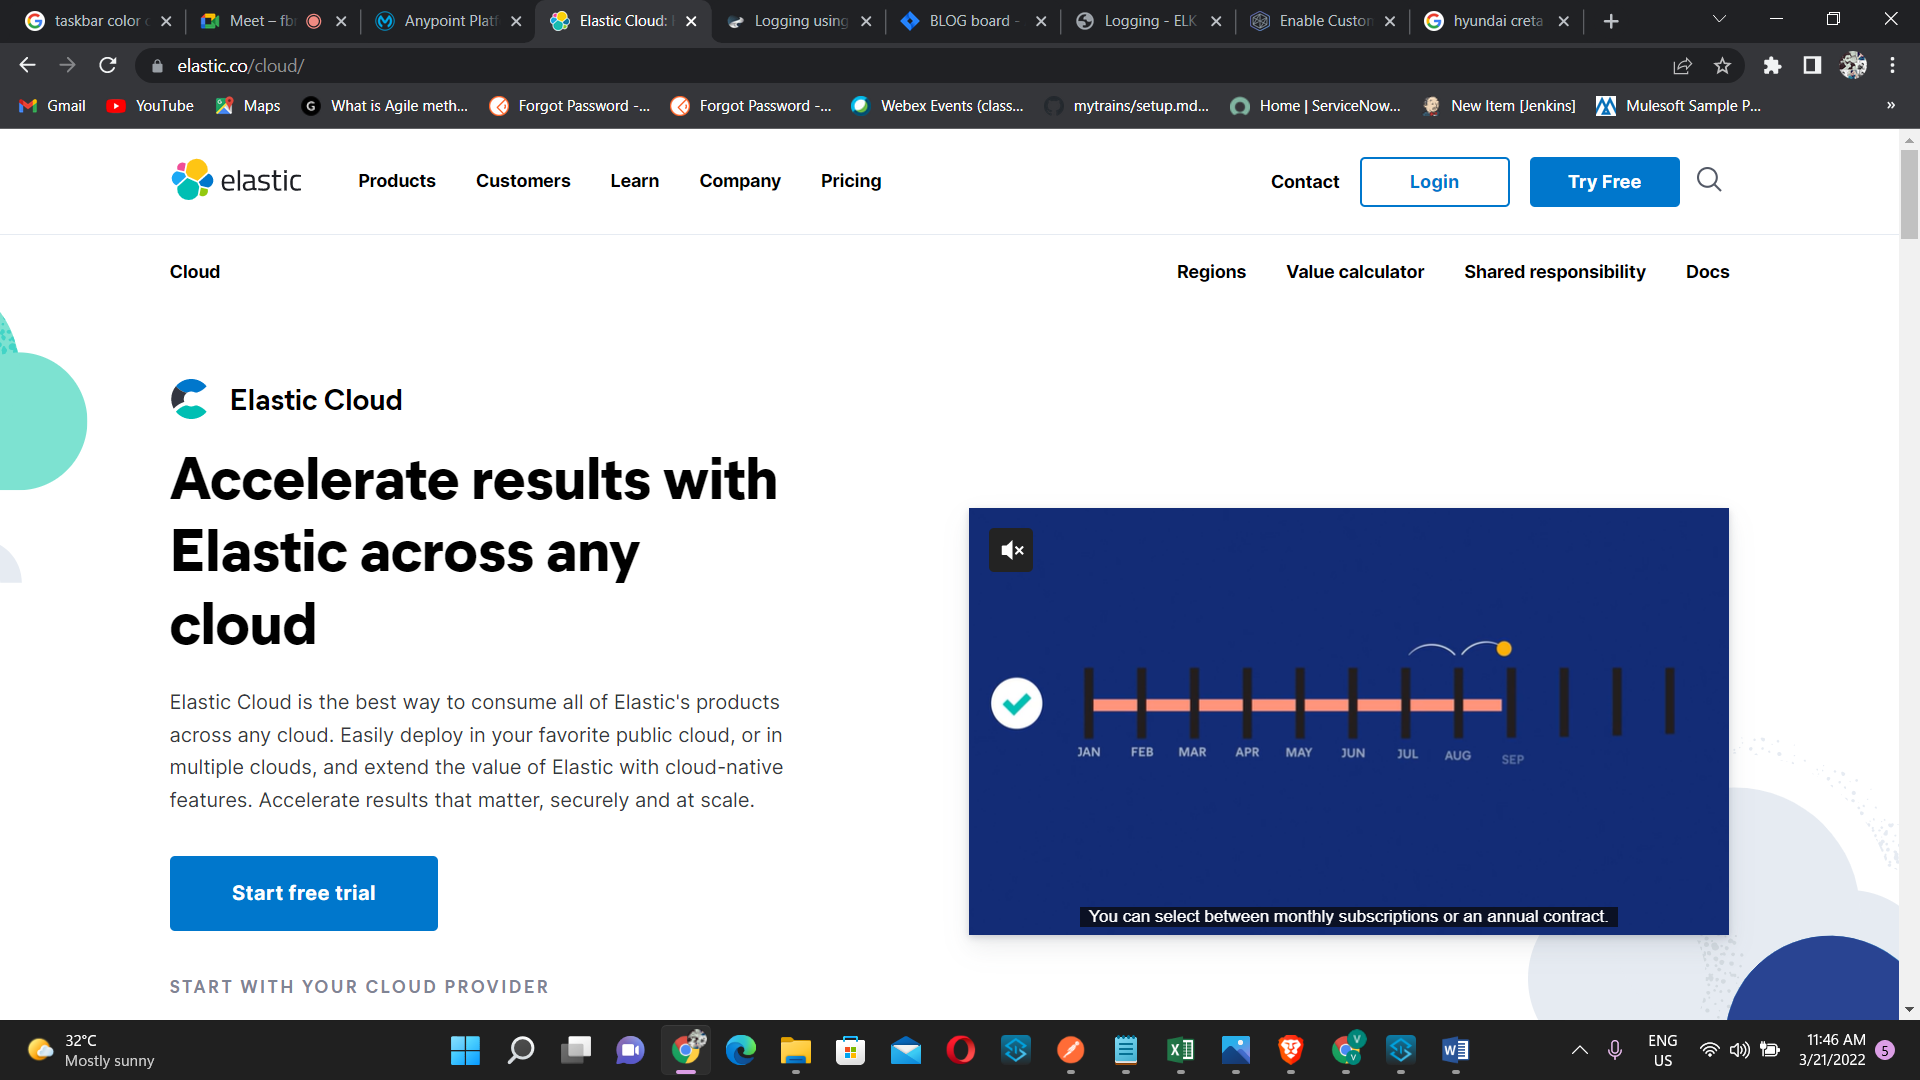
Here we are using http appender for externalizing logs from cloudhubs to Elastic cloud.First of all we need to register on https://www.elastic.co/cloud/
Figure 1
Then we have to login into the registered account,here we are only getting 14 days trail period after that we have to pay for the service we are using.
Figure
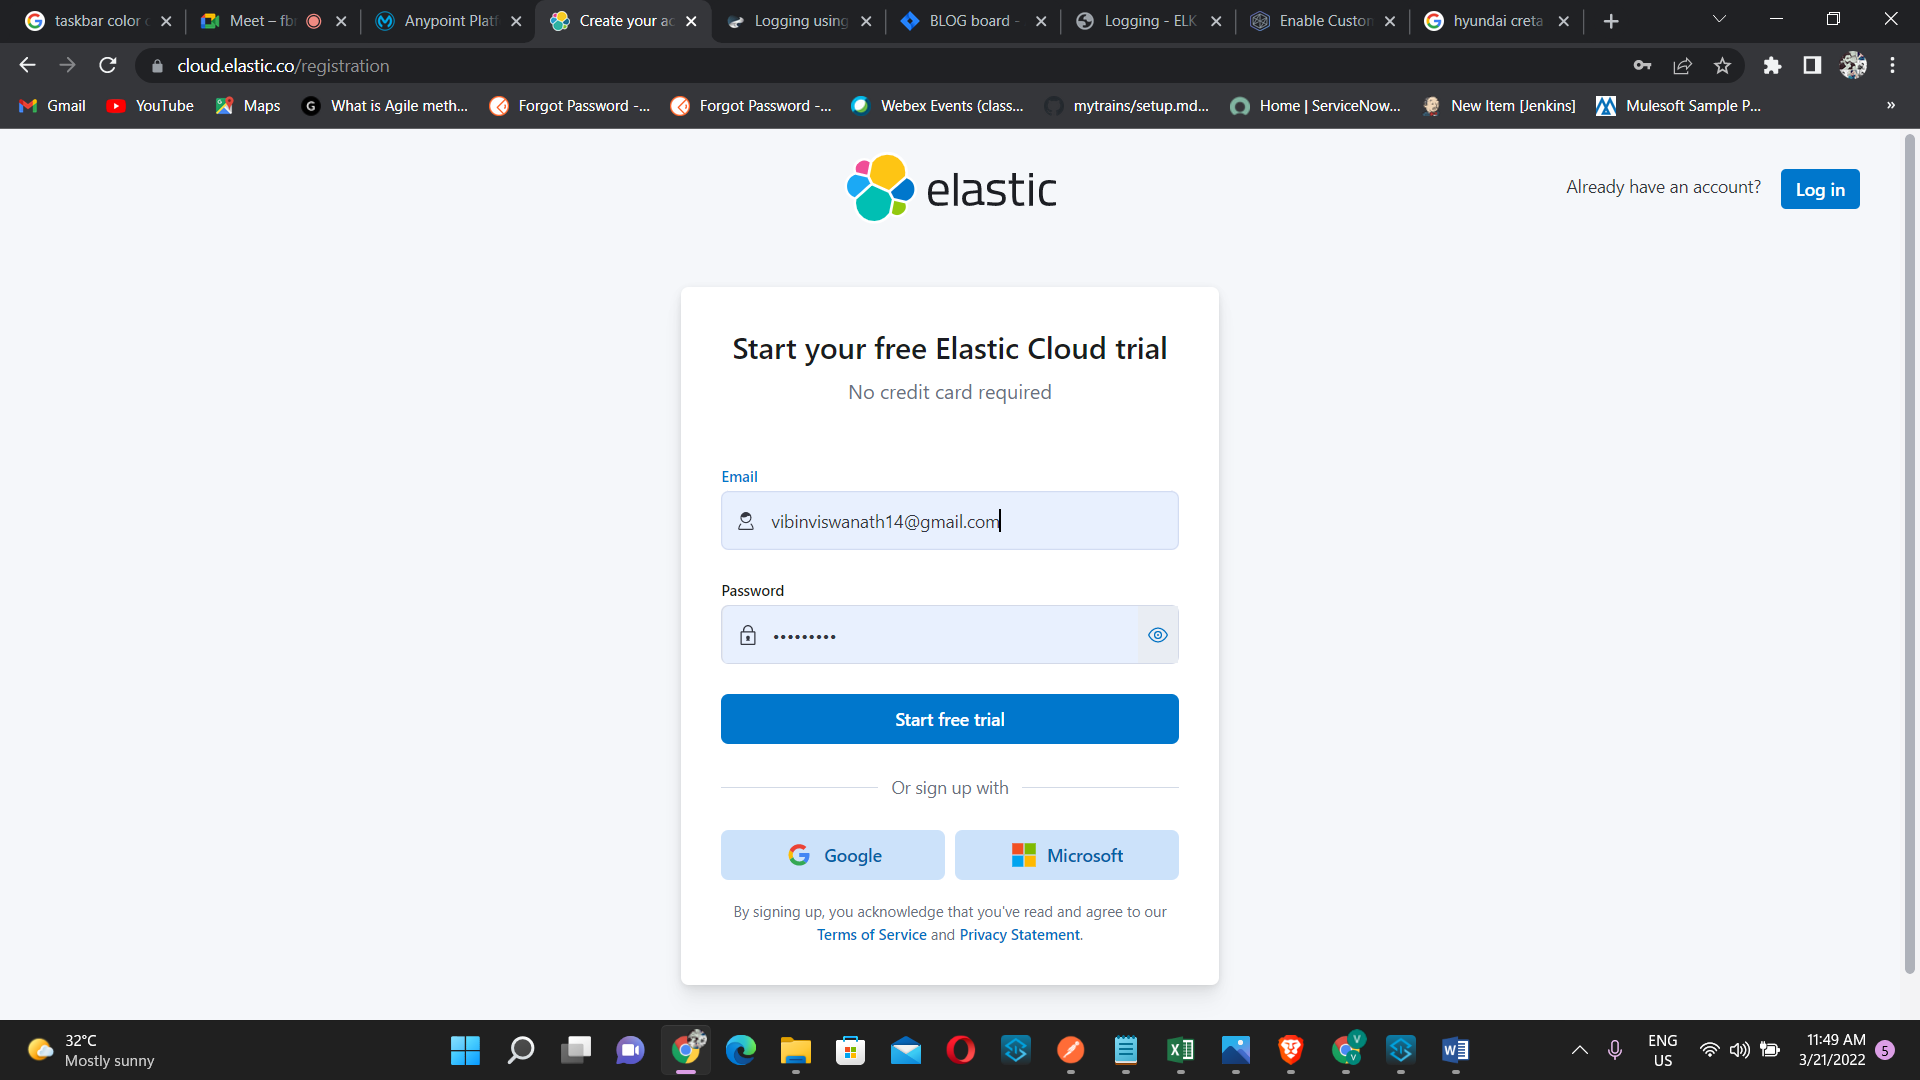
When you login for first time, it will ask you to create a default ELK deployment which will install ElasticSearch and Kibana installation as below:
Figure 3
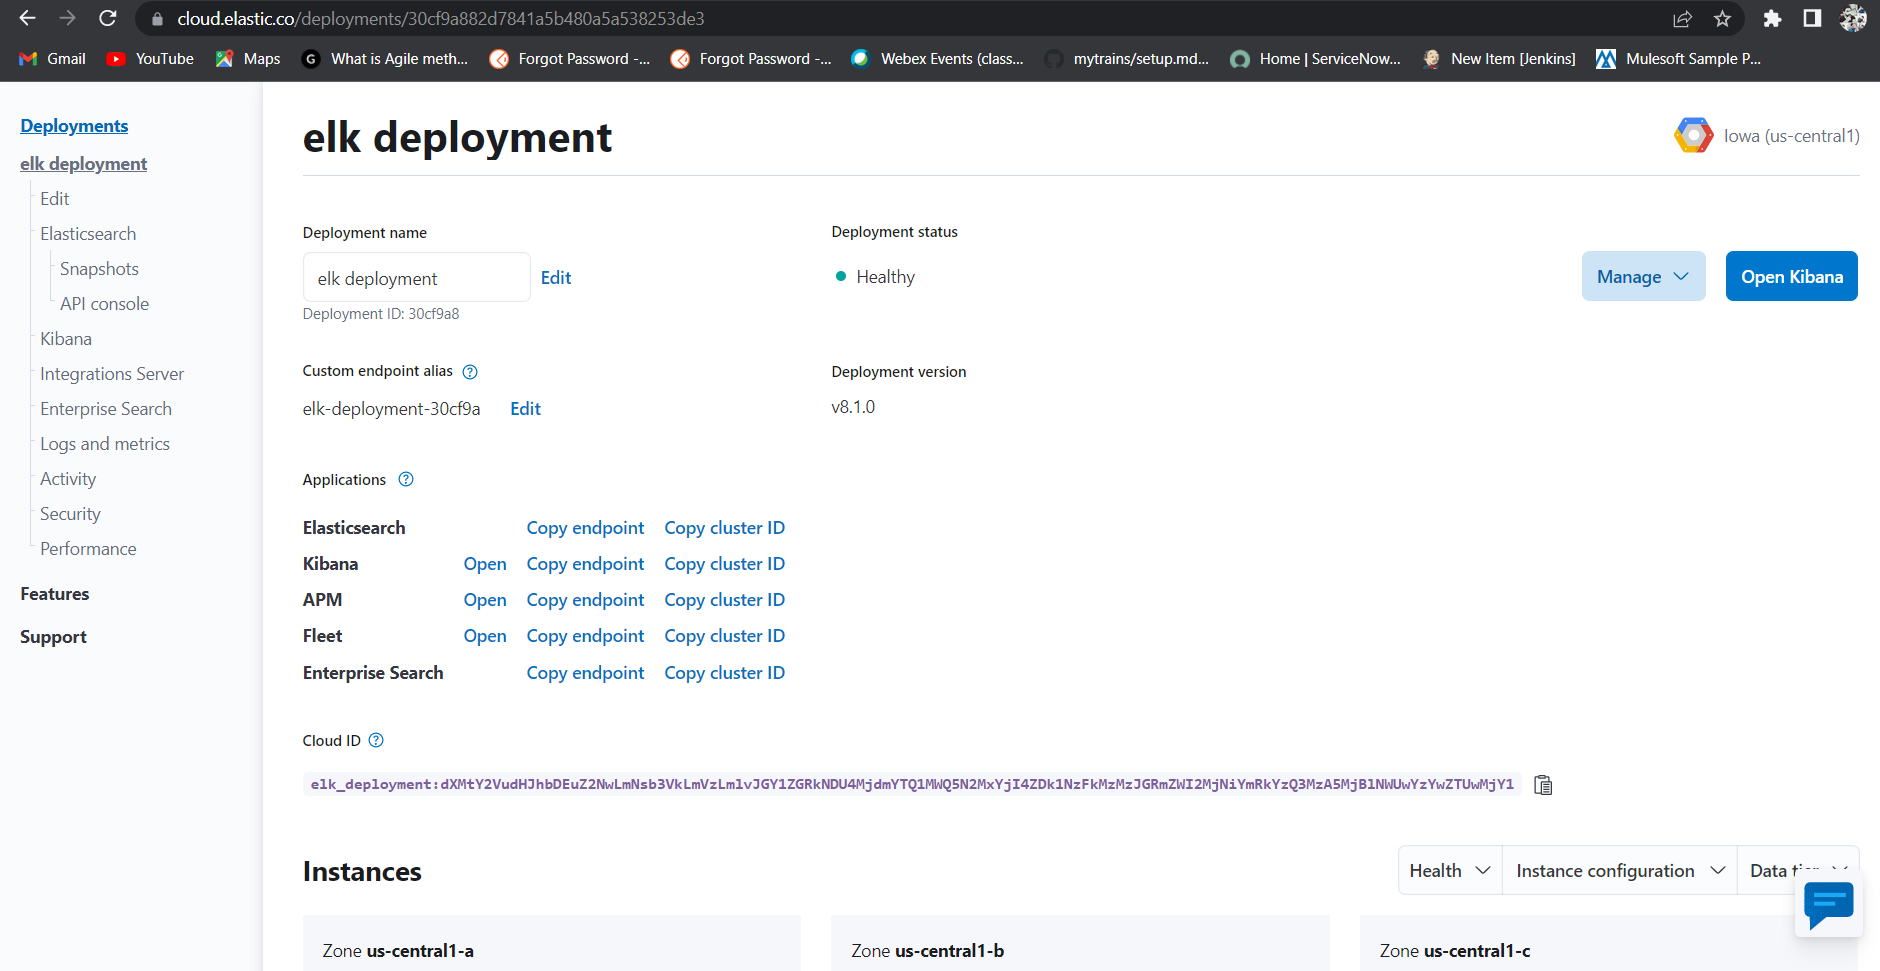
In the figure 3 we can see the end point of our applications such as Elastic search,Kibana etc. These endpoint are required for logging purpose. It will also create username and password for elastic search, we can note it down or download that credentials in an excel file.
Figure 4

Figure 4, shows the instance configuration where elk has been installed.
After that we have to create sample mule application . Here I have created an application which will send json body through post method and stores the payload in a vaiable and simply print the json payload.
Figure 5

Now goto project explorer and Open src/main/resoruces/log4j2.xmlThen we have add http appender xml tag in the below configuration
<Http name="ELK"

    url="https://elk-deployment-30cf9a.es.us-central1.gcp.cloud.es.io:9243/vlogs/\_doc">

    <JsonLayout compact=*"true" eventEol="true" properties="true" />

    <Property name="Content-Type" value="application/json" />

    <Property name="Authorization" value="Basic ZWxhc3RpYzpESUFsZTZUUndKSld2Sm5FQ3lUUmtHemg=" />

    <PatternLayout pattern="%-5p %d [%t] [processor: %X{processorPath}; event: %X{correlationId}] %c: %m%n" />

</Http>
In the above xml tag the the url given is the elastic search endpoint url which can get from the manage deployment section like in the above figure 3.The vlogs after the url specify the index you want to use.Also we use either _doc or _create in order to create the Index on Kibana.
The property name Authorization can obtained from the credentials that we got earlier while login into the elastic cloud, Authorization is base64(Username + “:” + password) you can also generate the same using Basic Authentication Header Generator. Also we need to add below xml tag in Configuration/Loggers/AsyncRoot.
    <AsyncRoot level=*"INFO">

    <AppenderRef ref=*"ELK" />

    </AsyncRoot>
Now run and check the mule application in anyppoint studio and generate some logs by hitting the end point, if its giving logs without any http appender error then we are good to go, now we have to check if the index is created or not for that,
- We have to go to elastic cloud account, then click on management
Figure 6

- Then we will go to this page
Figure 7
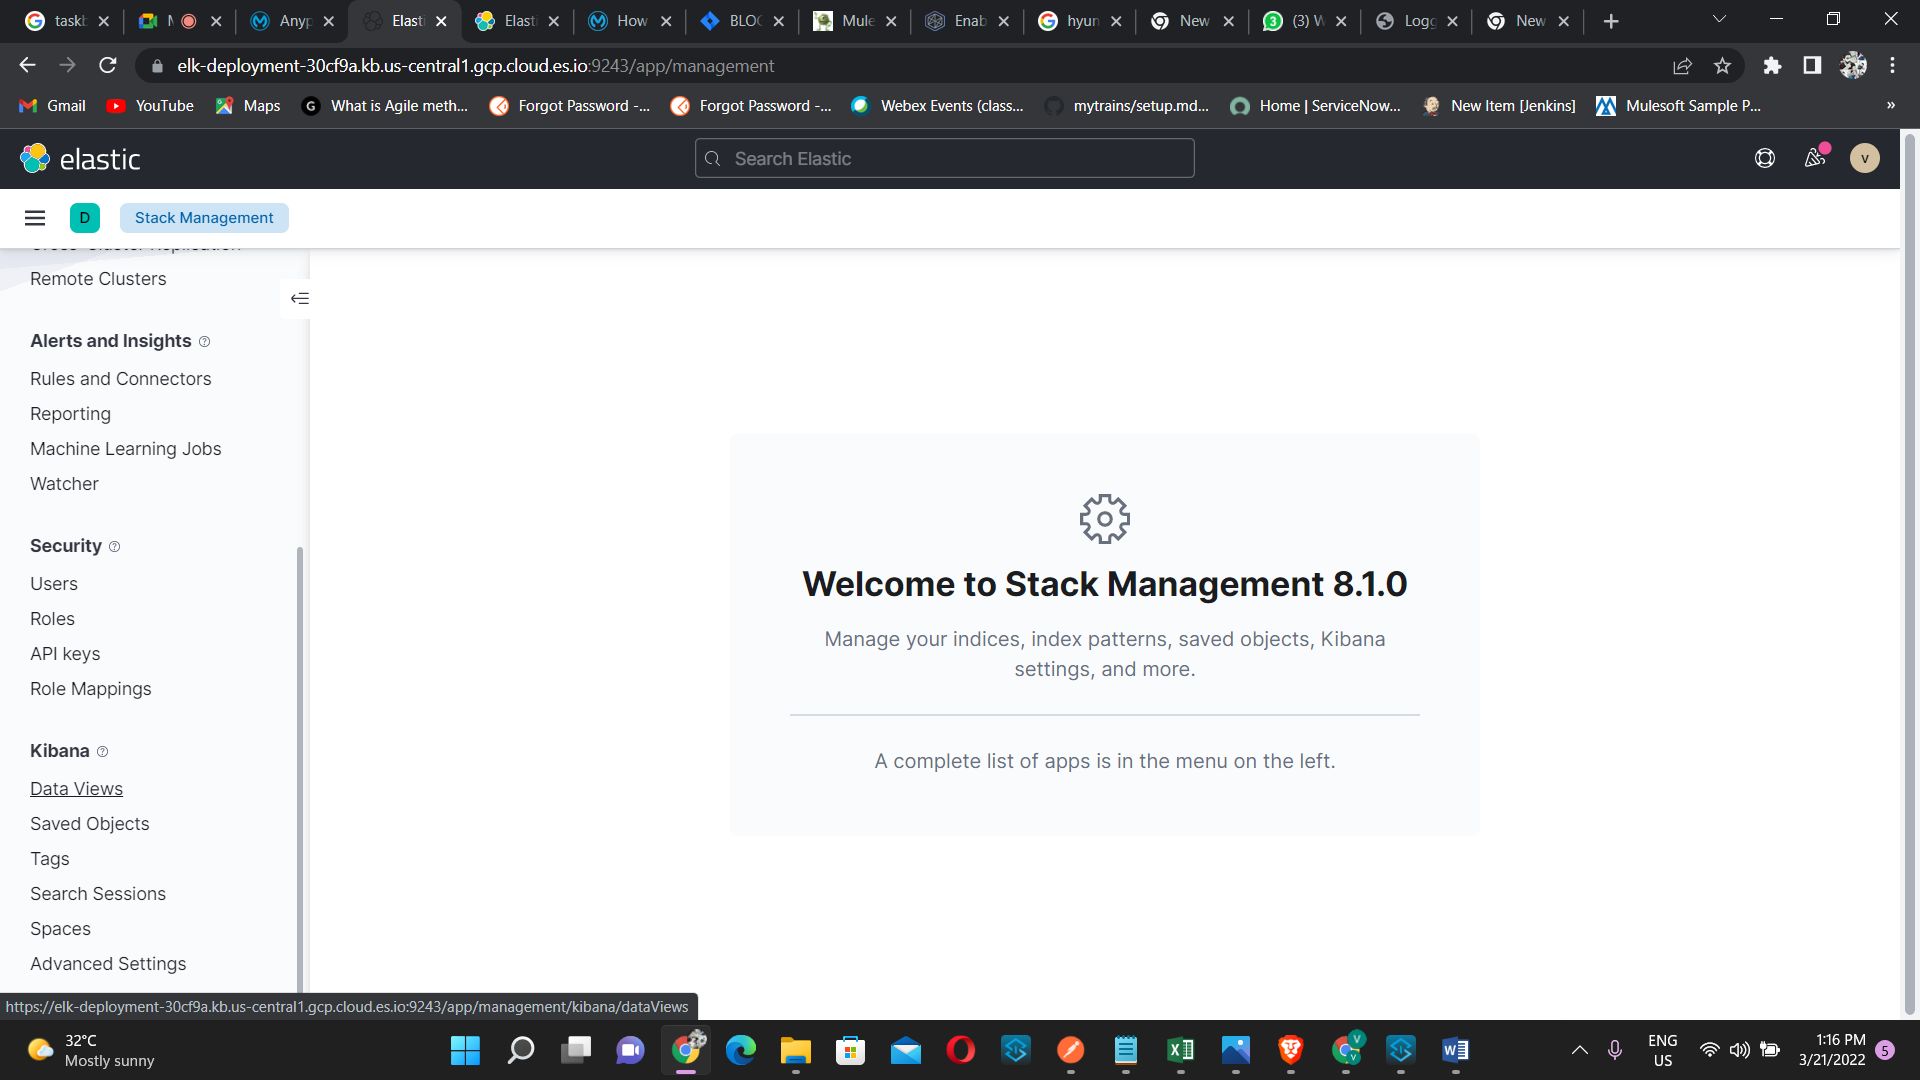
- Then we have go to Data views under Kibana then it will go to, DataViews
Figure 8

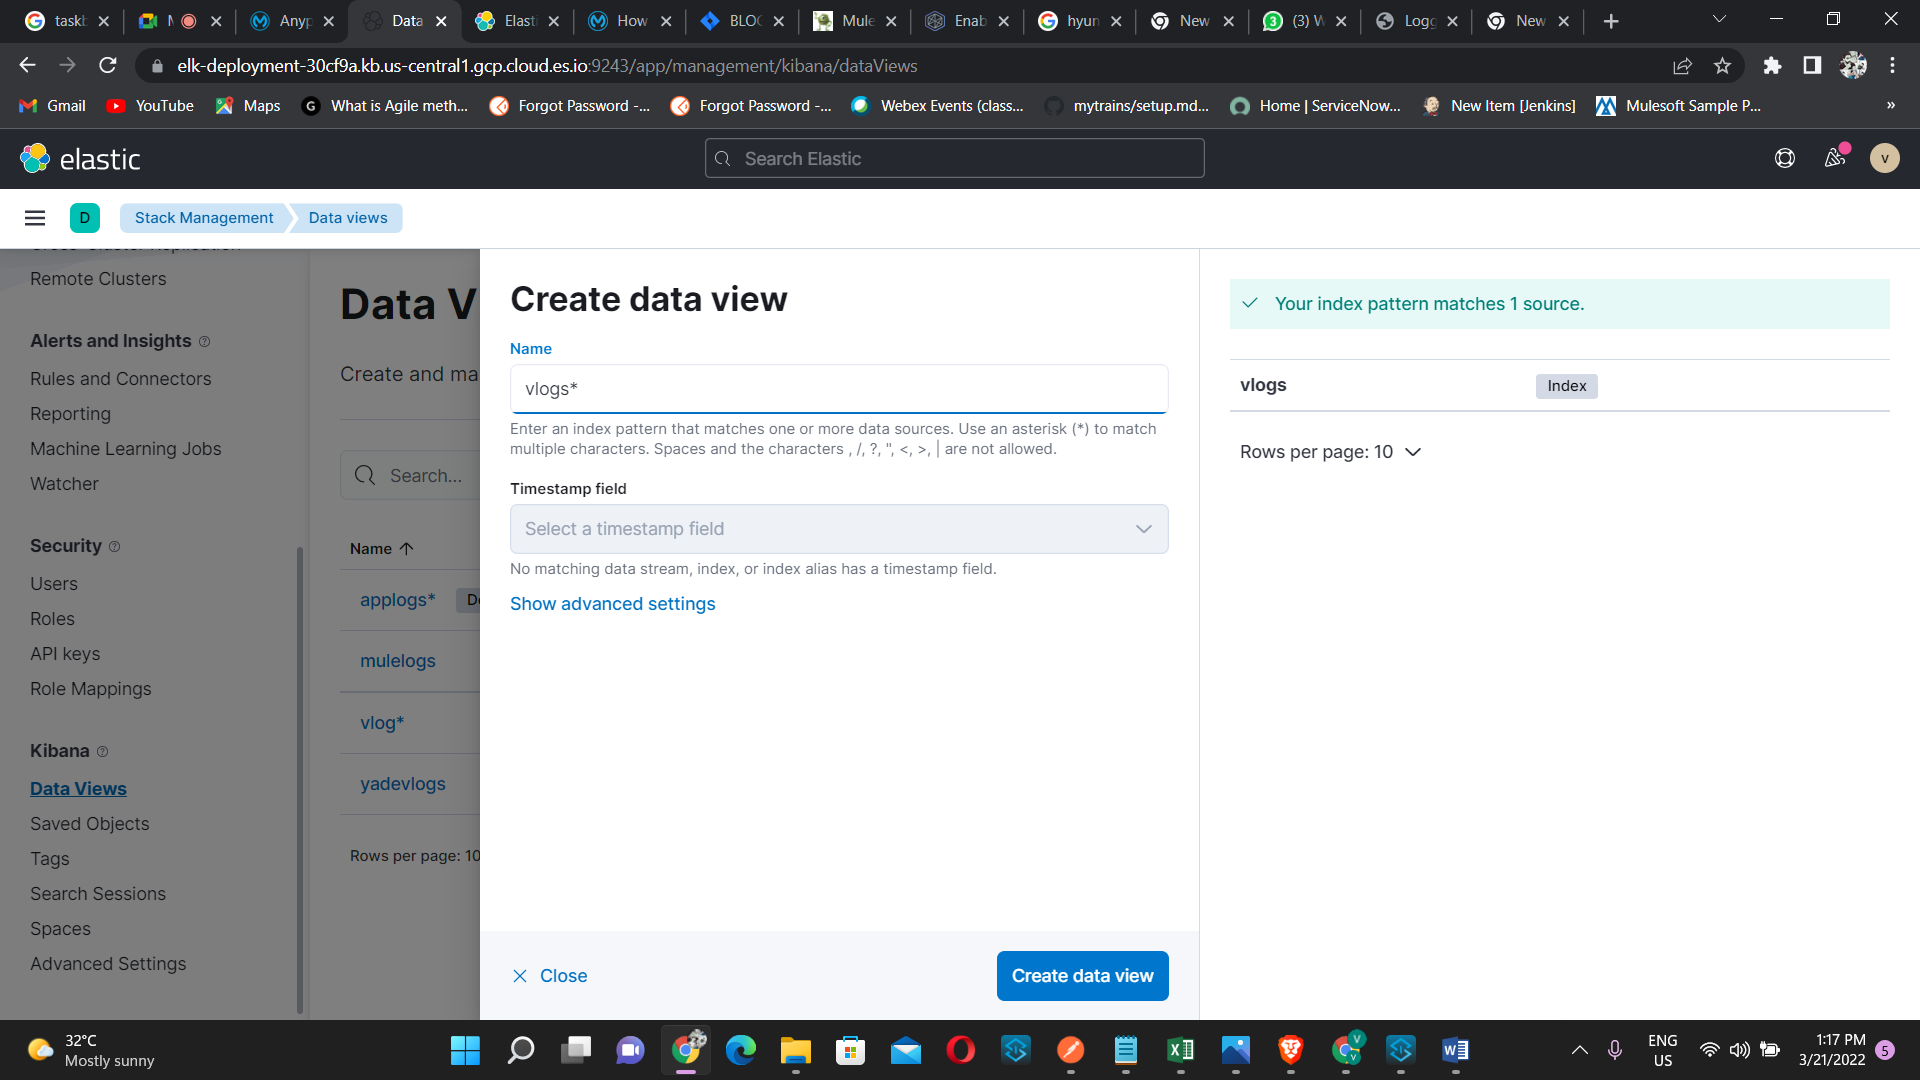
- Now click on Create data view, and type the index name that we have give after the url here we have given the index name as “vlogs”, it will automatically created when we deploy the application, now click on create data view.
Figure 9
- Now click on discover option under Analytics
Figure 10
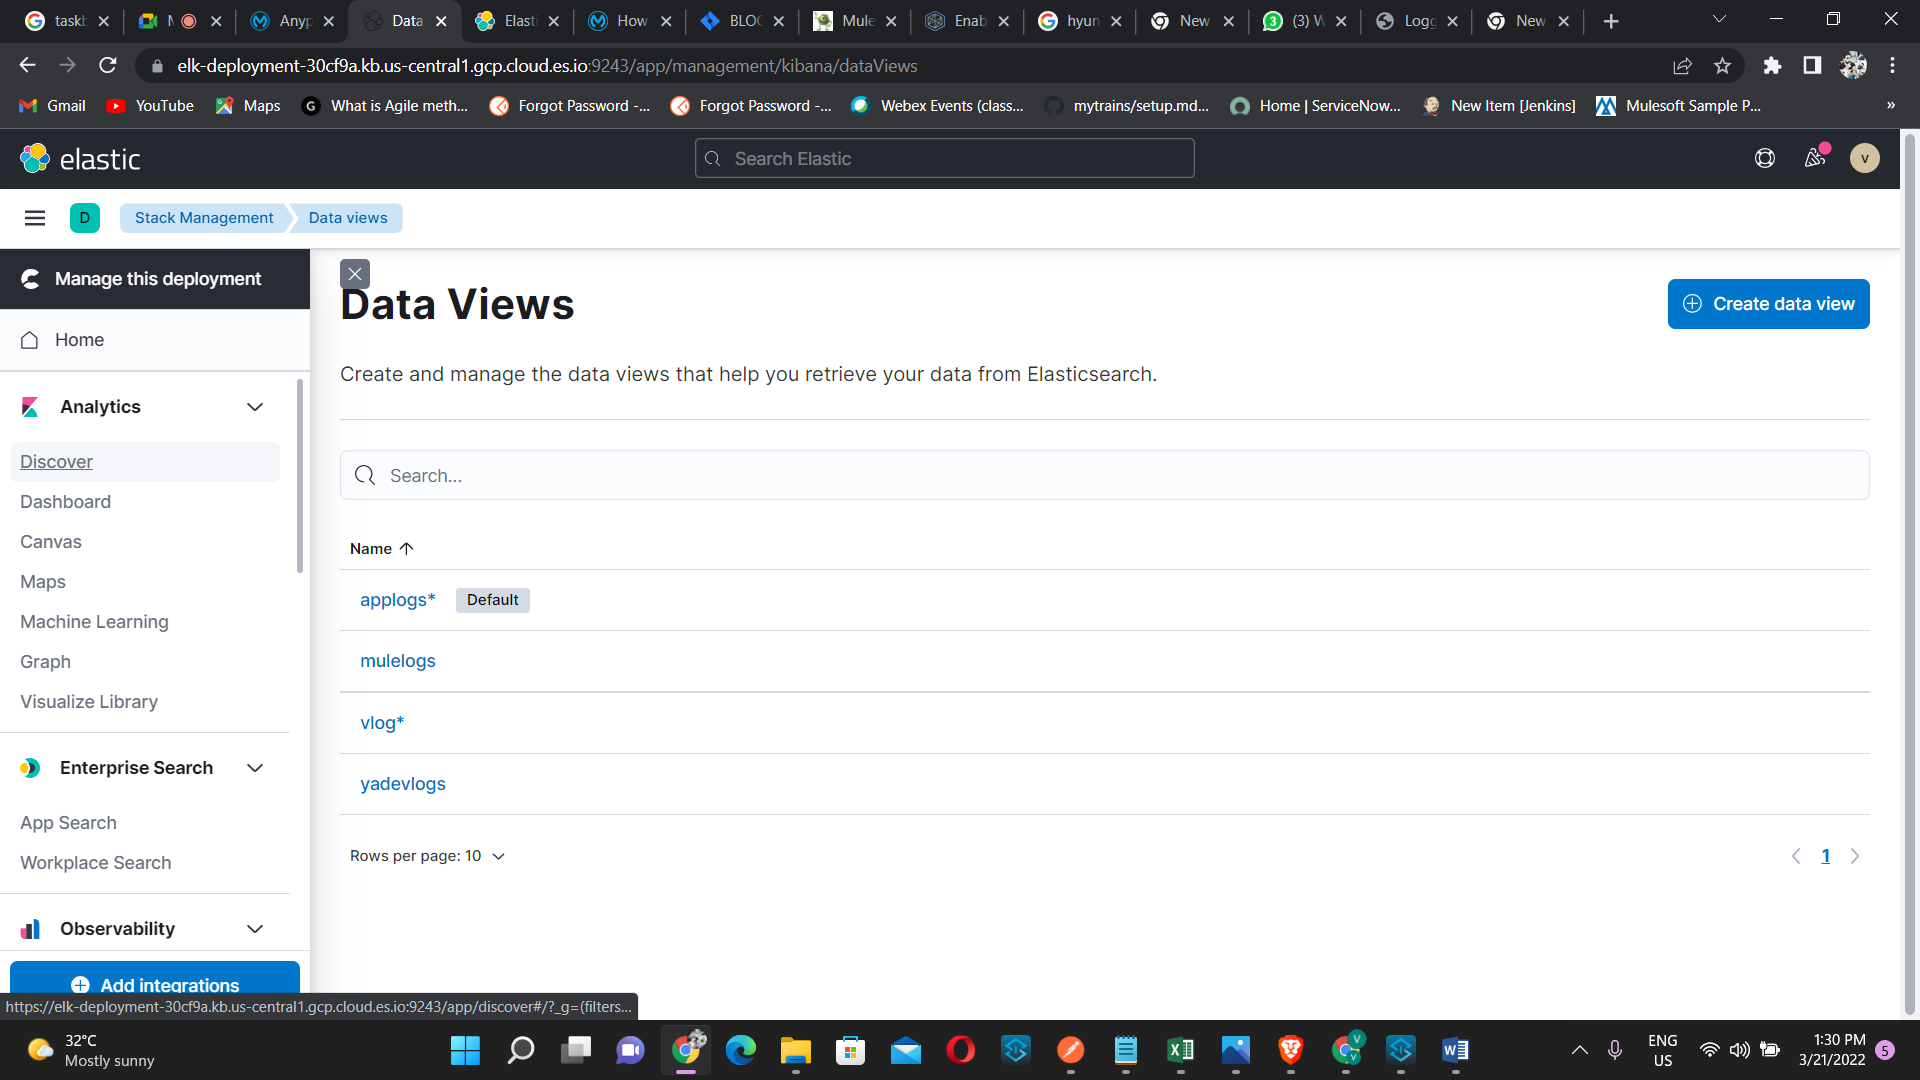
- Now we can see that vlog, on the right side we can the logs
Figure 11

- So here our main agenda is to externalize cloudlogs of our mule application.We need to add more loggers like Log4J2CloudhubLogAppender into your log4j2.xml to enable logging on the cloudhub log console of your application.
After adding all the necessary xml tags the log4j file will look like this,
<?xml version="1.0" encoding="utf-8"?>
<Configuration>

    <!--These are some of the loggers you can enable.
        There are several more you can find in the documentation.
        Besides this log4j configuration, you can also use Java VM environment variables
        to enable other logs like network (-Djavax.net.debug=ssl or all) and
        Garbage Collector (-XX:+PrintGC). These will be append to the console, so you will
        see them in the mule_ee.log file. -->

    <Appenders>
        <RollingFile name="file" fileName="${sys:mule.home}${sys:file.separator}logs${sys:file.separator}elk-sample-api.log"
                 filePattern="${sys:mule.home}${sys:file.separator}logs${sys:file.separator}elk-sample-api-%i.log">
            <PatternLayout pattern="%-5p %d [%t] [processor: %X{processorPath}; event: %X{correlationId}] %c: %m%n"/>
            <SizeBasedTriggeringPolicy size="10 MB"/>
            <DefaultRolloverStrategy max="10"/>
        </RollingFile>
<Http name="ELK"
    url="https://elk-deployment-30cf9a.es.us-central1.gcp.cloud.es.io:9243/vlogs/_doc">
    <JsonLayout compact="true" eventEol="true" properties="true" />
    <Property name="Content-Type" value="application/json" />
    <Property name="Authorization" value="Basic ZWxhc3RpYzpESUFsZTZUUndKSld2Sm5FQ3lUUmtHemg=" />
    <PatternLayout pattern="%-5p %d [%t] [processor: %X{processorPath}; event: %X{correlationId}] %c: %m%n" />
</Http>
<Log4J2CloudhubLogAppender name="CLOUDHUB" addressProvider="com.mulesoft.ch.logging.DefaultAggregatorAddressProvider" applicationContext="com.mulesoft.ch.logging.DefaultApplicationContext" appendRetryIntervalMs="${sys:logging.appendRetryInterval}" appendMaxAttempts="${sys:logging.appendMaxAttempts}" batchSendIntervalMs="${sys:logging.batchSendInterval}" batchMaxRecords="${sys:logging.batchMaxRecords}" memBufferMaxSize="${sys:logging.memBufferMaxSize}" journalMaxWriteBatchSize="${sys:logging.journalMaxBatchSize}" journalMaxFileSize="${sys:logging.journalMaxFileSize}" clientMaxPacketSize="${sys:logging.clientMaxPacketSize}" clientConnectTimeoutMs="${sys:logging.clientConnectTimeout}" clientSocketTimeoutMs="${sys:logging.clientSocketTimeout}" serverAddressPollIntervalMs="${sys:logging.serverAddressPollInterval}" serverHeartbeatSendIntervalMs="${sys:logging.serverHeartbeatSendIntervalMs}" statisticsPrintIntervalMs="${sys:logging.statisticsPrintIntervalMs}">
<PatternLayout pattern="[%d{MM-dd HH:mm:ss}] %-5p %c{1} [%t]: %m%n"/>
</Log4J2CloudhubLogAppender>
    </Appenders>

    <Loggers>
        <!-- Http Logger shows wire traffic on DEBUG -->
        <!--AsyncLogger name="org.mule.service.http.impl.service.HttpMessageLogger" level="DEBUG"/-->
        <AsyncLogger name="org.mule.service.http" level="WARN"/>
        <AsyncLogger name="org.mule.extension.http" level="WARN"/>

        <!-- Mule logger -->
        <AsyncLogger name="org.mule.runtime.core.internal.processor.LoggerMessageProcessor" level="INFO"/>

        <AsyncRoot level="INFO">
            <AppenderRef ref="file" />
            <AppenderRef ref="ELK" />


        </AsyncRoot>
    </Loggers>

</Configuration>
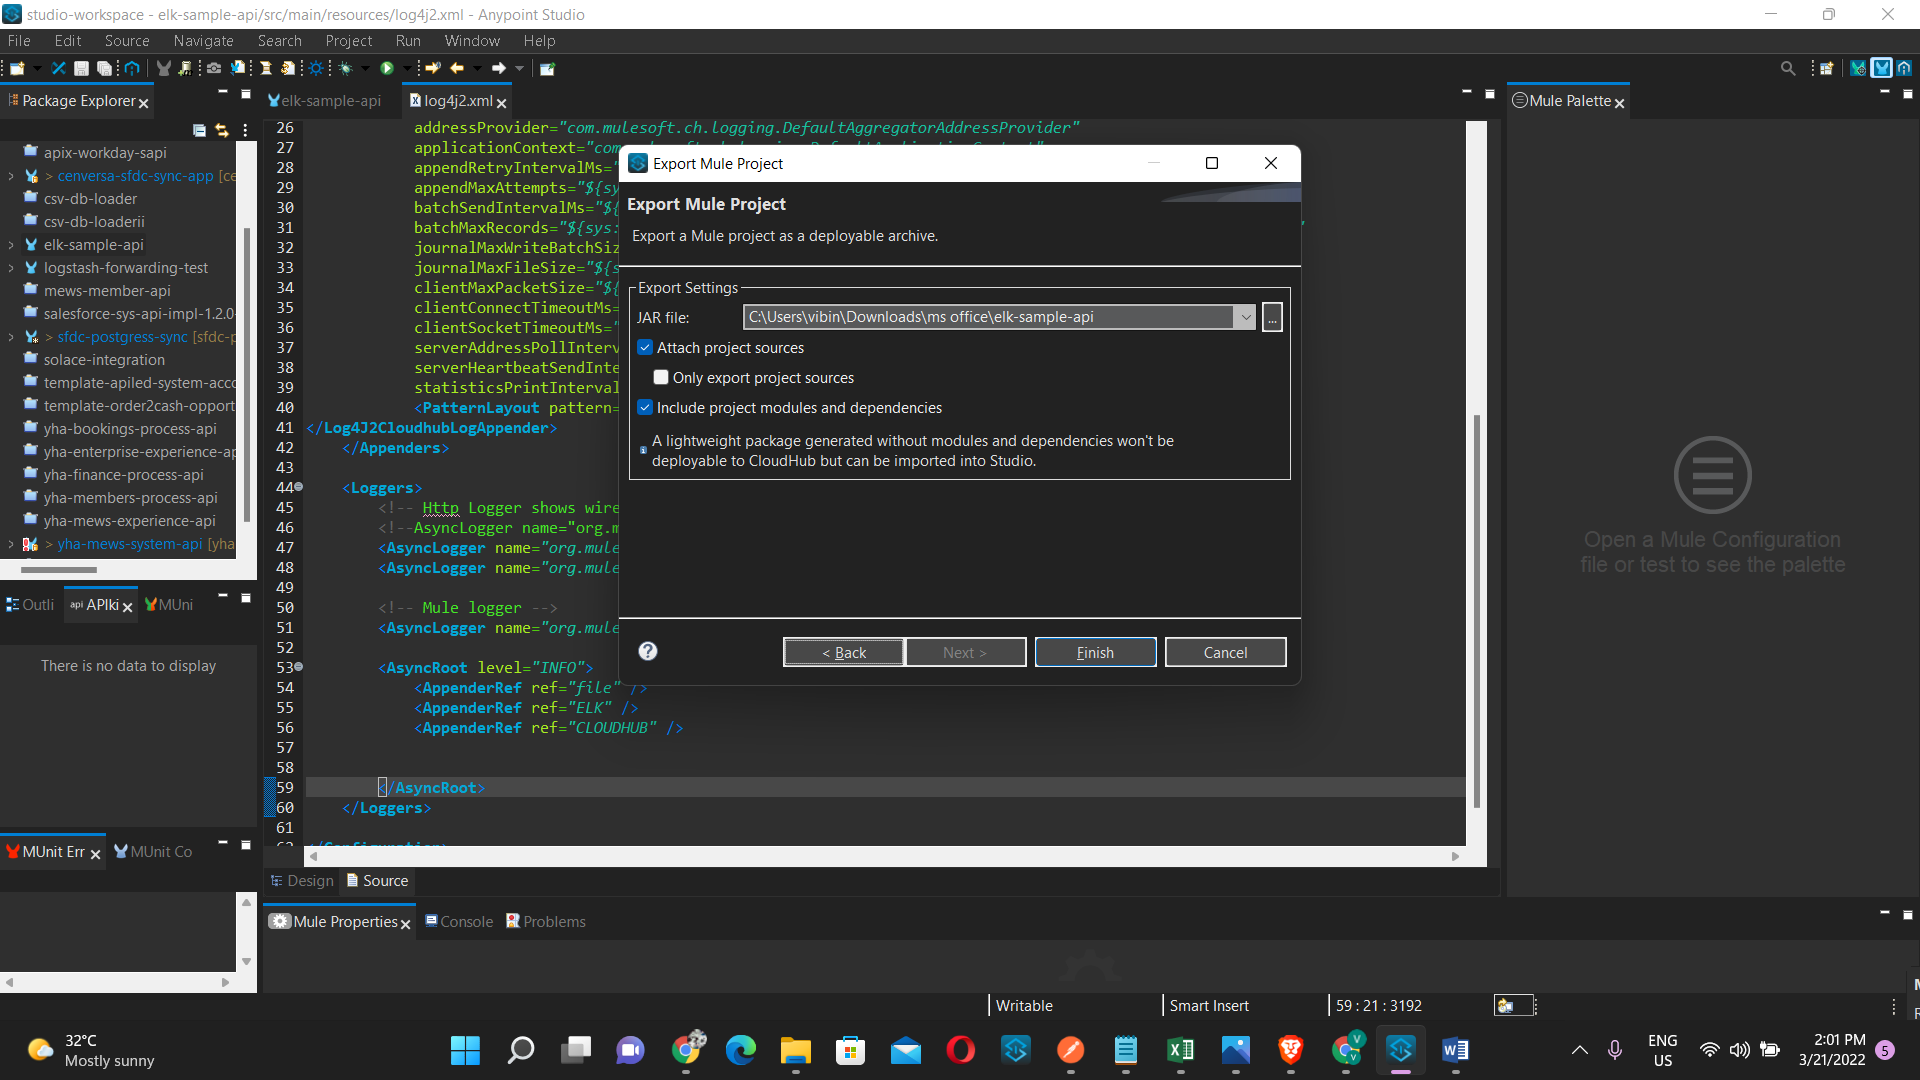
- Now we have to export the jar file and save the jar file ,here file name is
elk-sample-api
Figure 12
- Now we have to deploy the mule application in the cloudhub
Figure 13
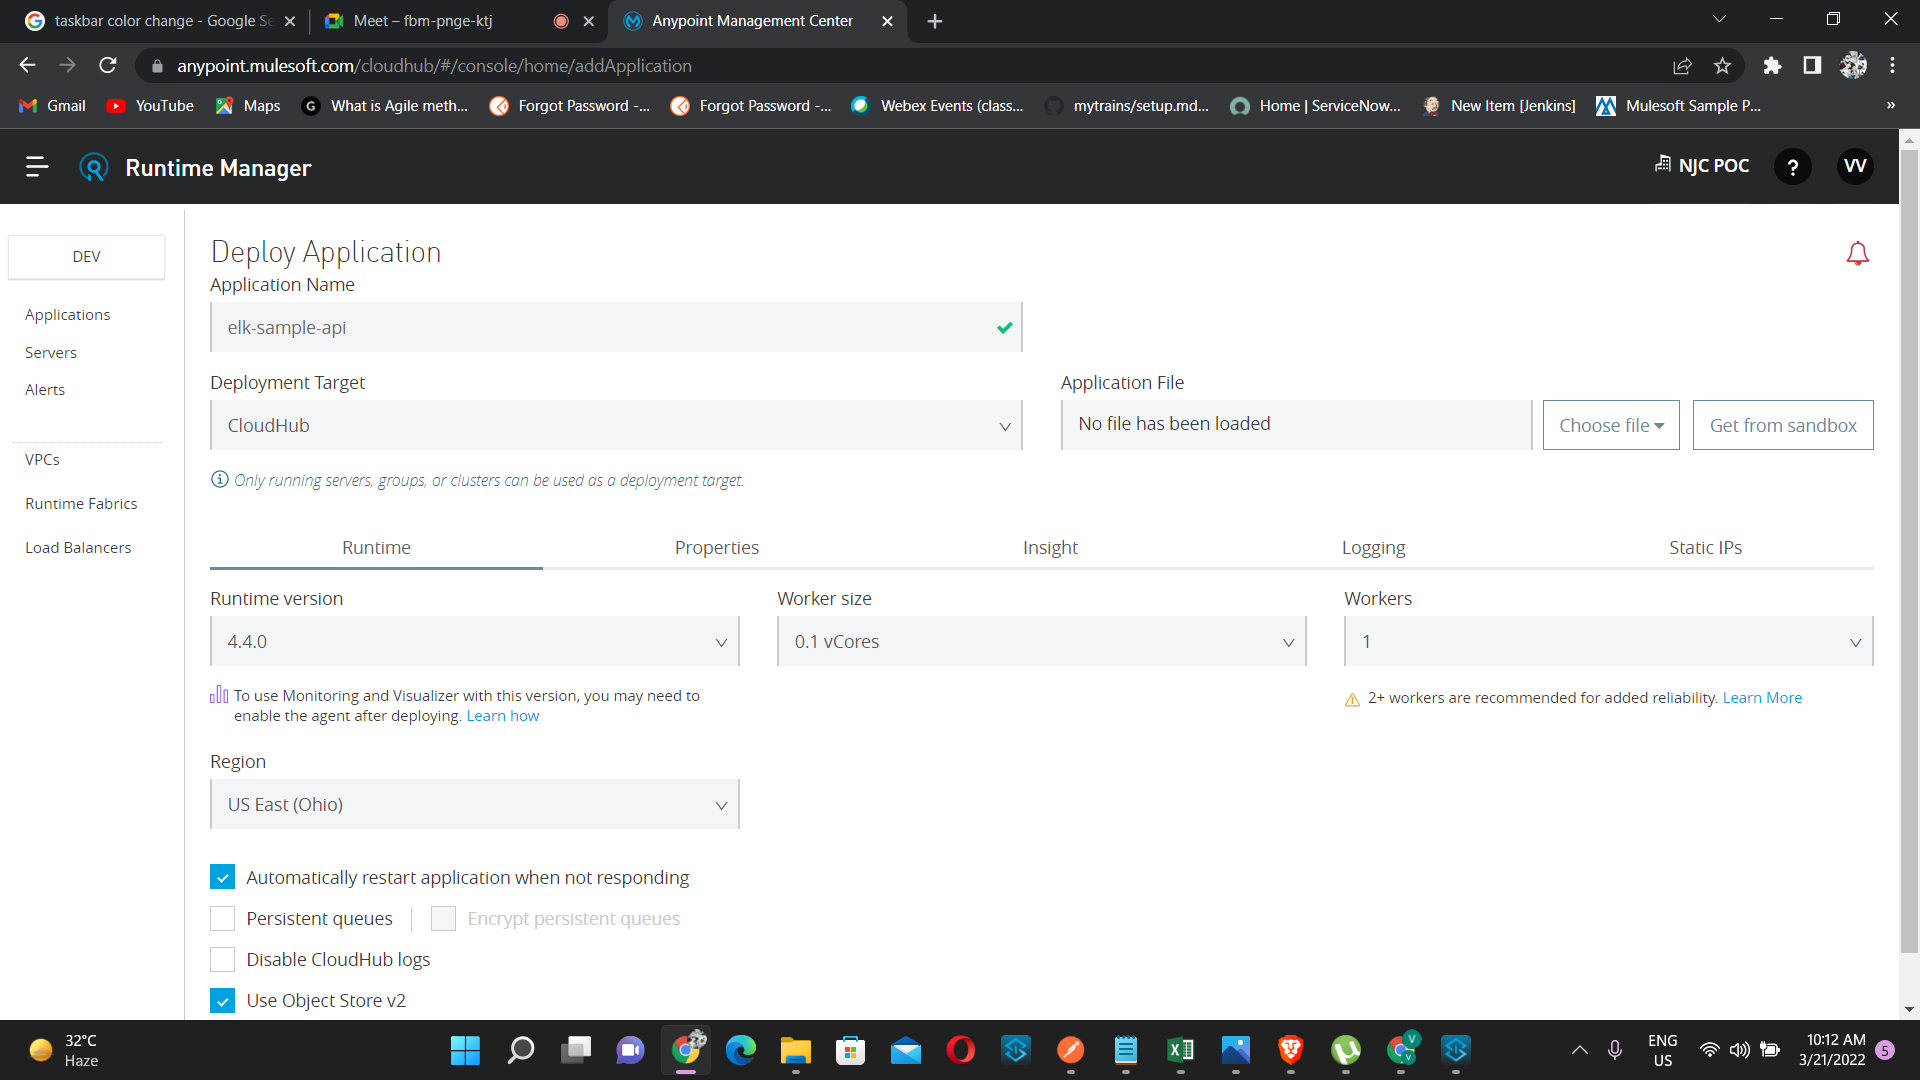
- Here click on disable CloudHub logs,
Figure 14

- Click on the two check box and apply changes
Figure 15
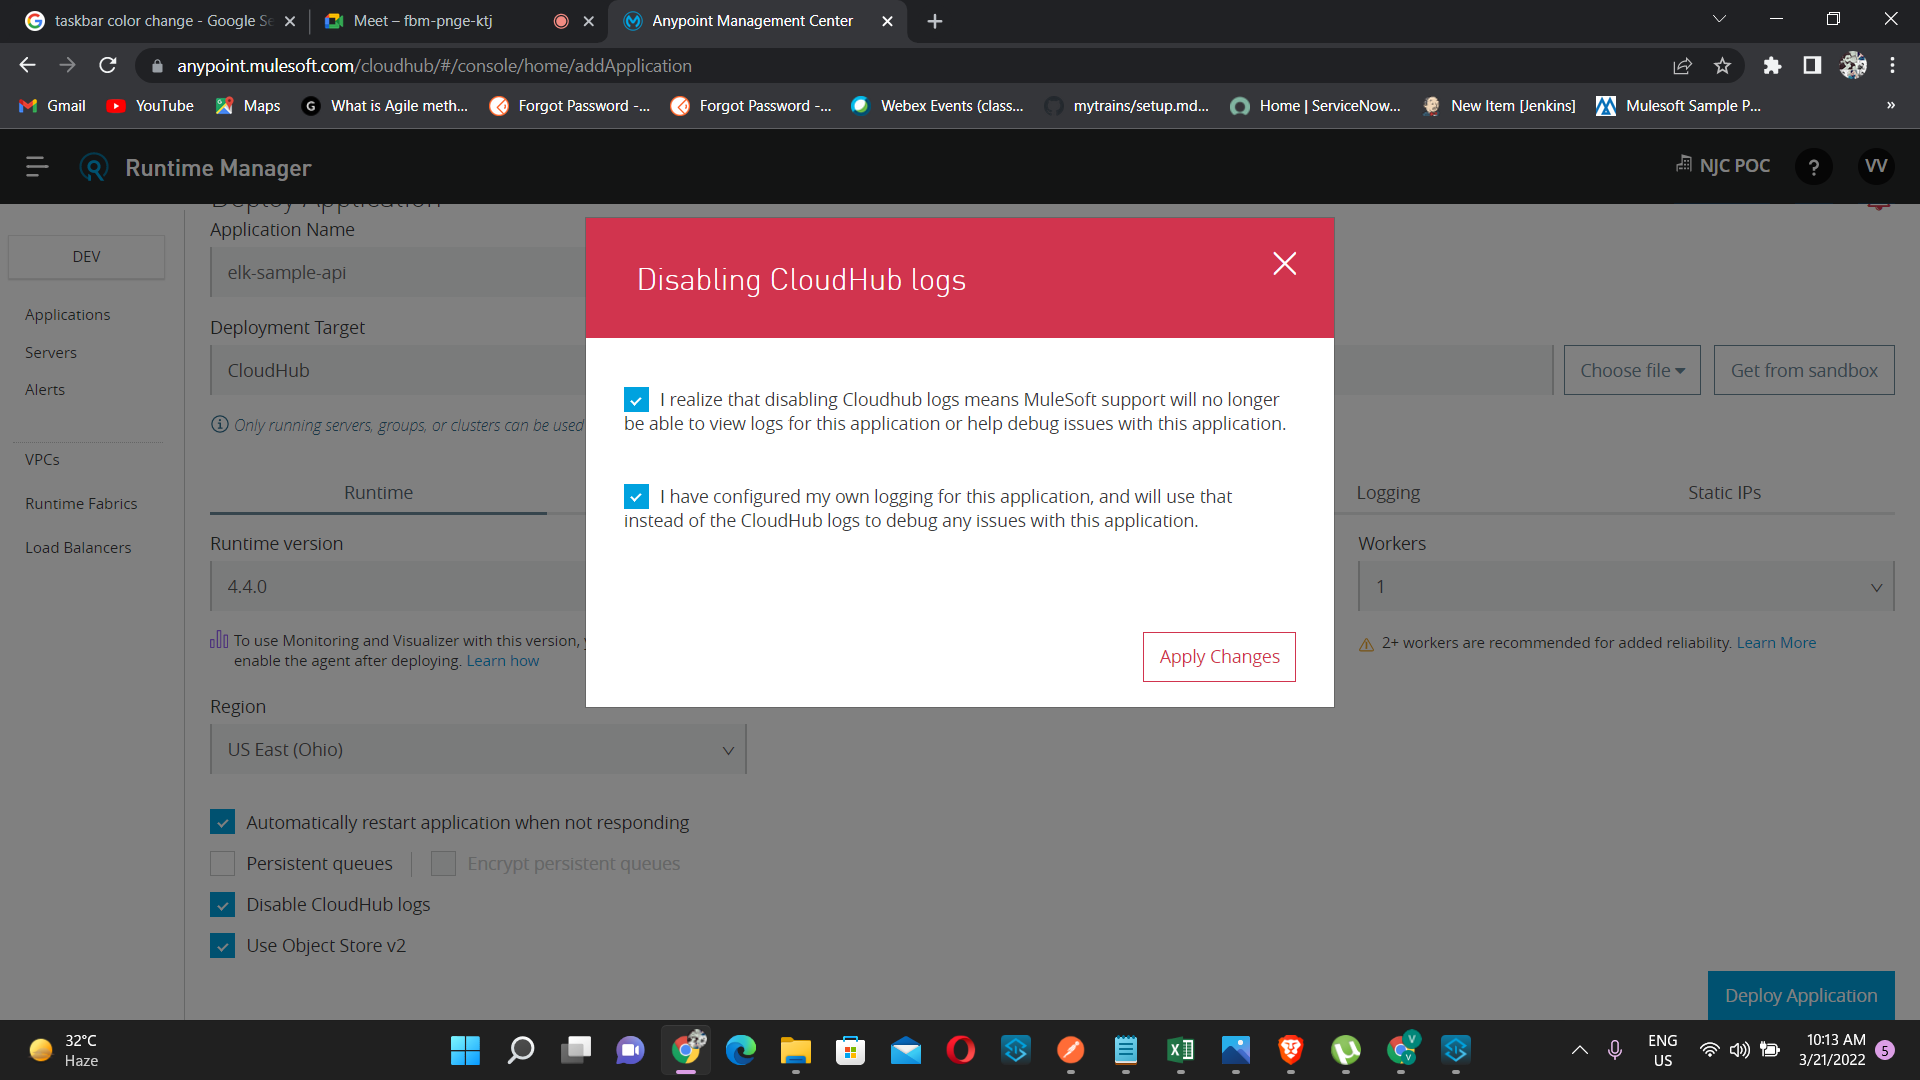
- Now deploy the application
Figure 16

- Wait for the application to get deployed, after deployment now we have to take the url and hit in postman to create some logs.
Figure 17
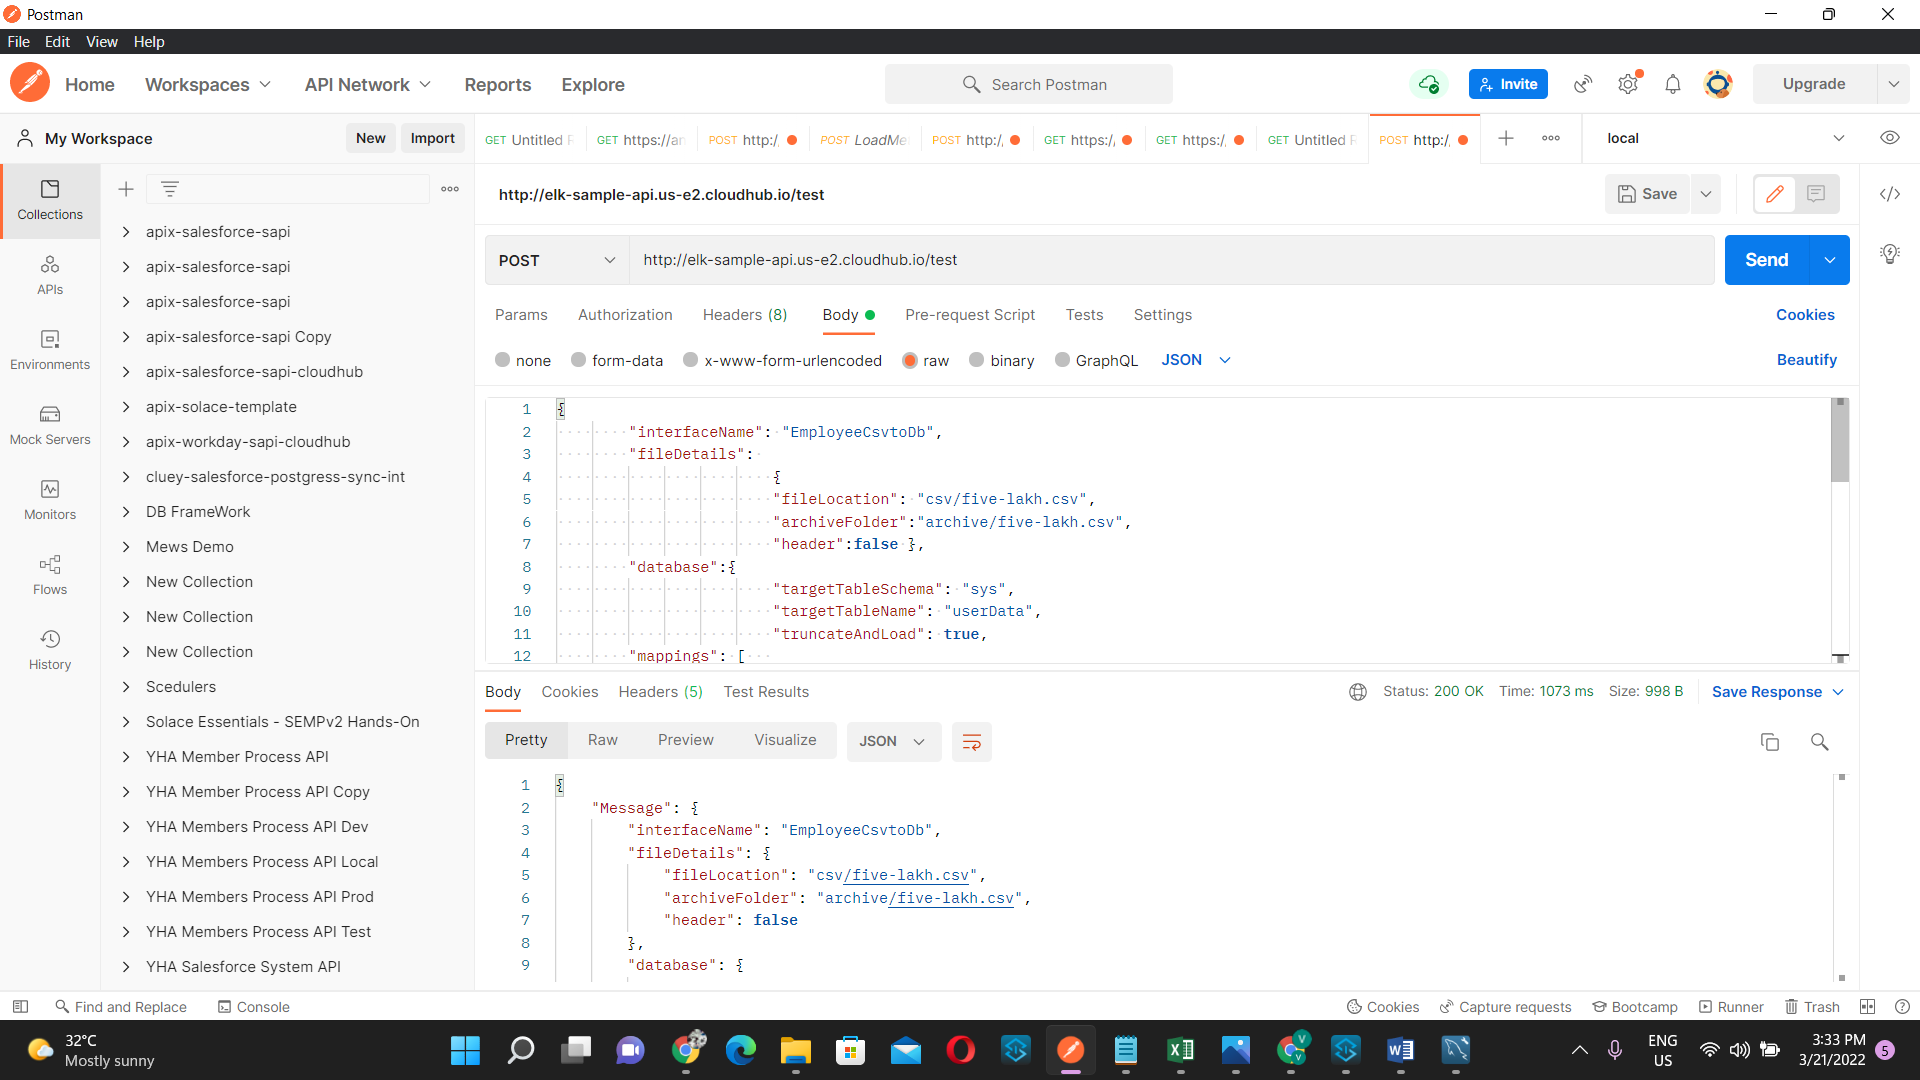
- Now go to elastic cloud account and check the logs like we have done above Figure 11
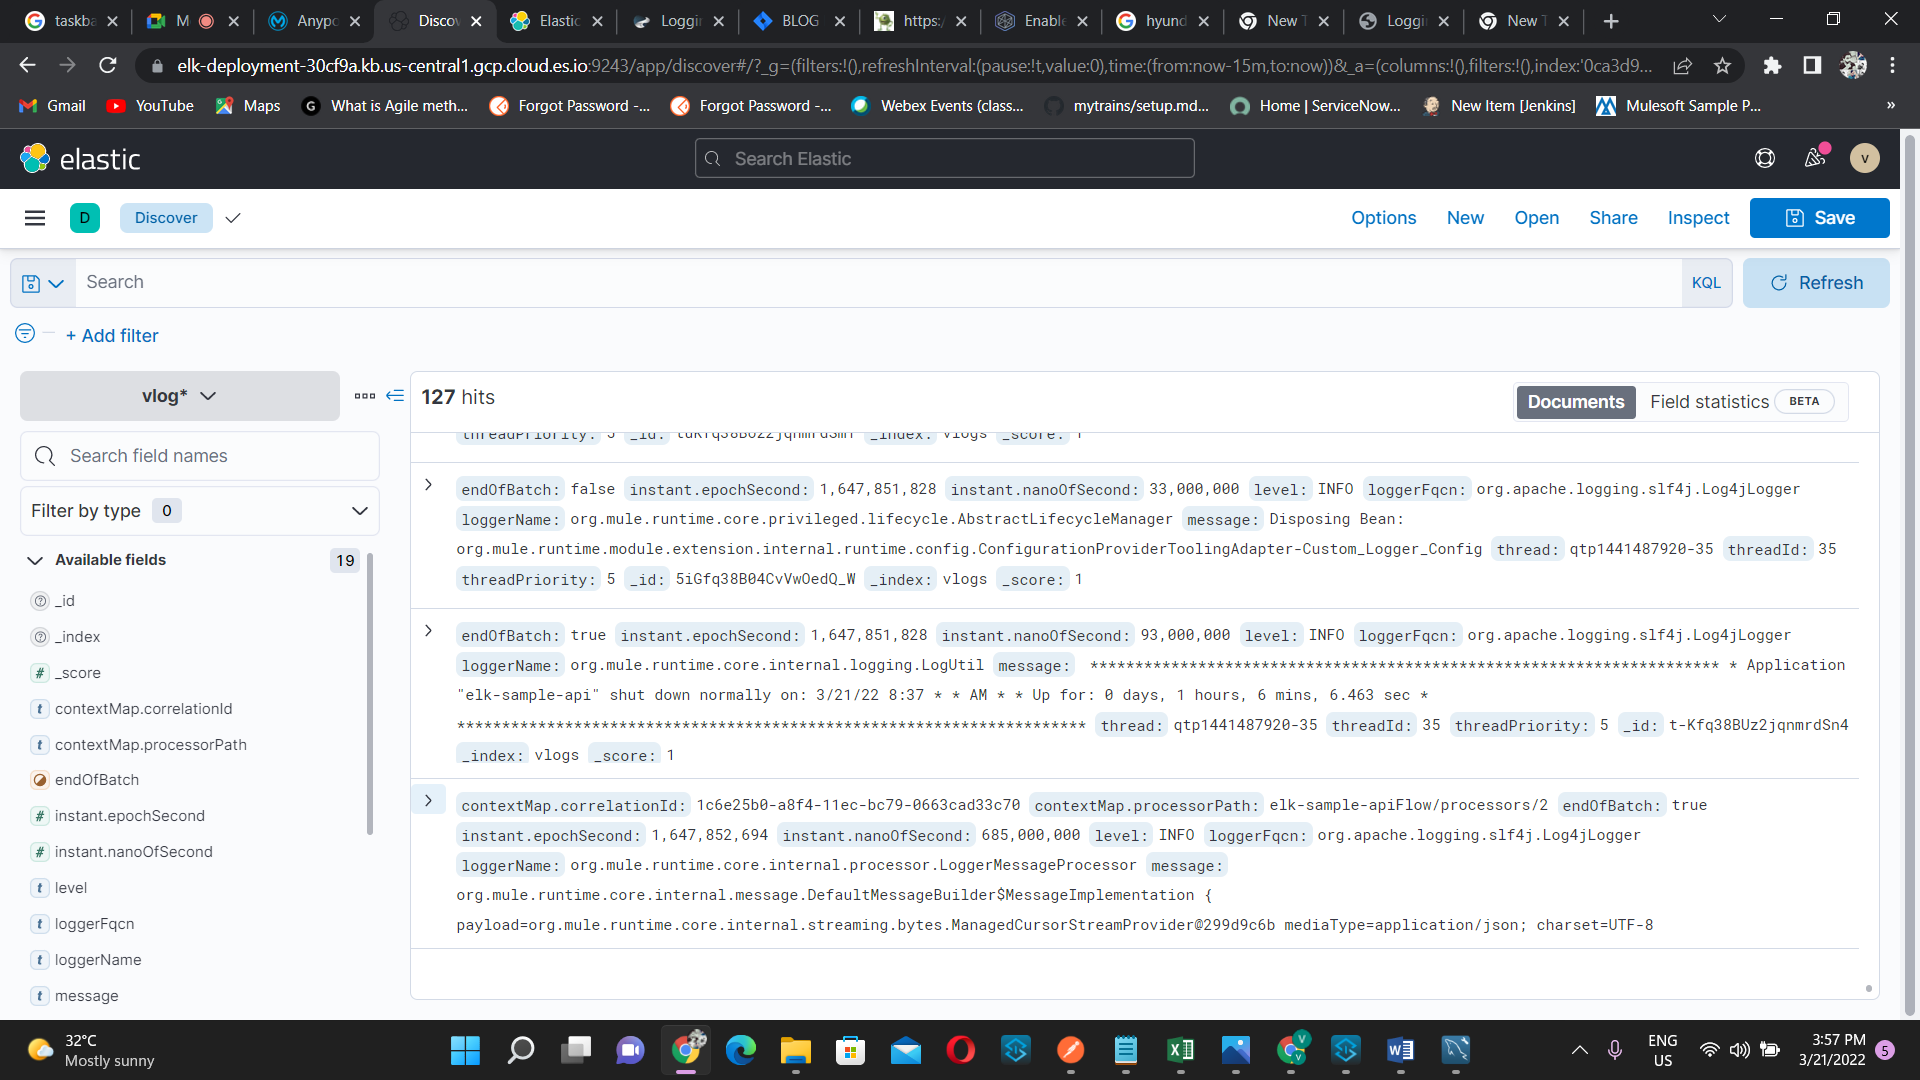
CloudHub logs is shown below

Conclusion
This is how you can enable CloudHub logging using Elastic cloud and HTTP Appender for MuleSoft applications.
References


