1. Overview
Anypoint monitoring is a feature that is provided by the MuleSoft Anypoint Platform which is used to monitor any application that we have deployed into cloudhub and hybrid environments. It is used to identify the state of an application to make decisions on some factors like scalability, availability or reliability of an API or an application. MuleSoft Anypoint monitoring also provides a high level view of how the applications are connected internally and also how the API-Led connectivity is addressed in your environment. From a developer point of view, it is used for analysis, troubleshooting and to identify various issues.
There are some advantages of using MuleSoft Anypoint monitoring. It helps to provide auto generated logs to find any failure or error in very fine granular level, for example in the connector level, which helps to reduce the mean time for a failure identification. It is also used to enhance the performance by doing a scaling which can be horizontal or vertical and can also provide alerts. The options available in MuleSoft Anypoint monitoring are: Built in Dashboards, Custom Dashboards, Alerts and Functional Monitoring. (For all subscriptions other than Titanium)
2. Anypoint platform subscription- Titanium and Anypoint Monitoring
There are different subscriptions for MuleSoft Anypoint platforms like Platinum, Gold, Titanium. In the Titanium version, there are a few more options available as shown below:
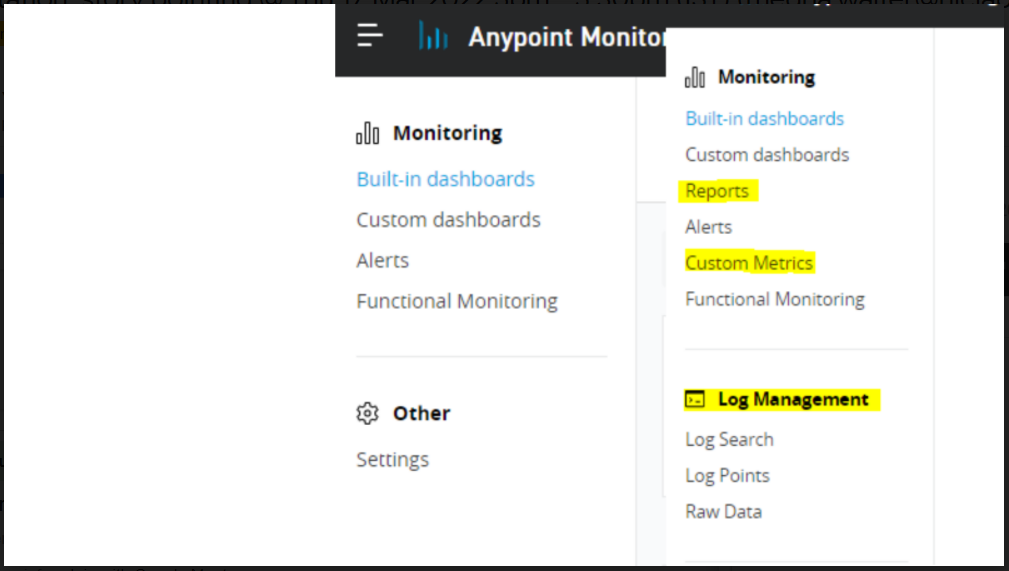
Reports are generally used to give a report analysis of a running application which shows options or tabs like requests, performance. Failures, CPU Utilization, Memory Utilization as shown below:
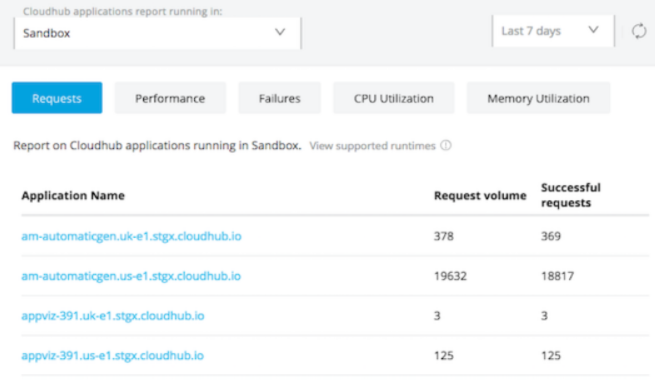
All these tabs will be present for a CloudHub deployment and may not be present for a hybrid/standalone since the infrastructure is maintained by the individual stand alone system or the hybrid system. In the above image, those are the applications deployed in CloudHub in the sandbox environment, request volume is the number of requests received from each application and successful requests are also provided.
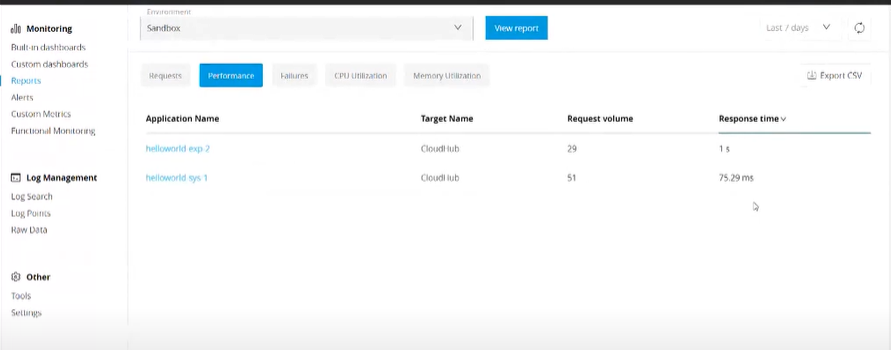
Performance tab gives the performance in response time as shown:
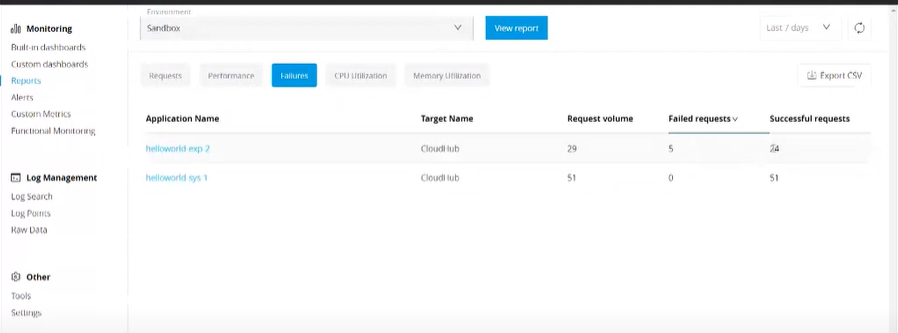
Failures gives a details on number of failed requests in an application as shown:
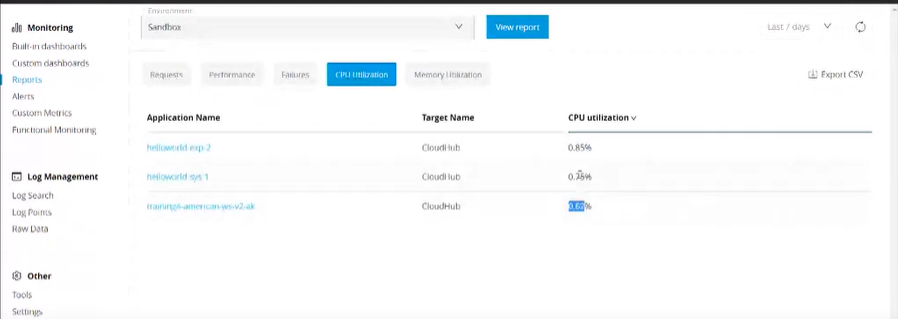
CPU Utilization reports are as follows:
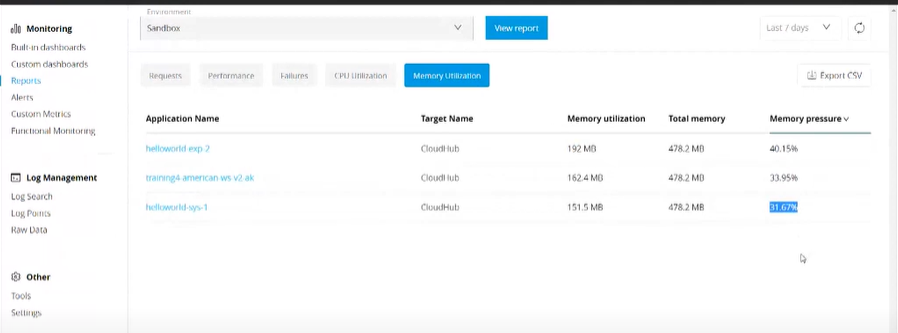
Memory Utilization reports are :
3.Log Management- Titanium
This option is used to troubleshoot, query and filter logs which also log search to find to any particular failures or bugs in an application through logs
3.1. LogSearch:
Log Search in Anypoint Monitoring is as shown below:
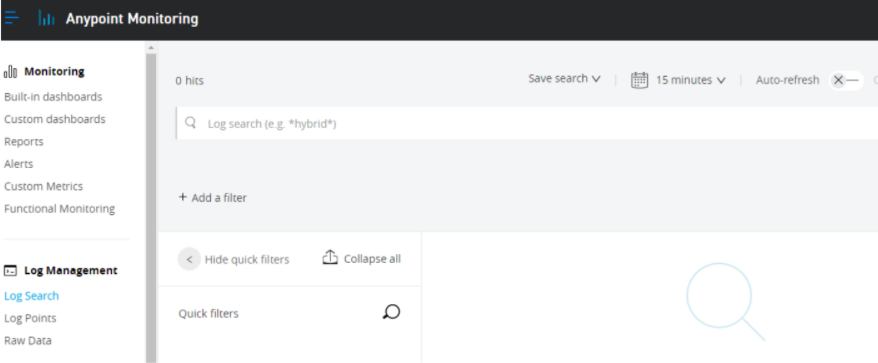
We can filter based on time and get a list of failures in that particular time span of an application. Log search also makes it simpler to search for only particular error logs based on our needs.
3.2. Log Point
This is another feature available in log management where we can apply logging on a particular connector. There are different levels of logging available that are applicable to each connector. They are DEBUG, INFO, WARN, ERROR. One is as shown below:
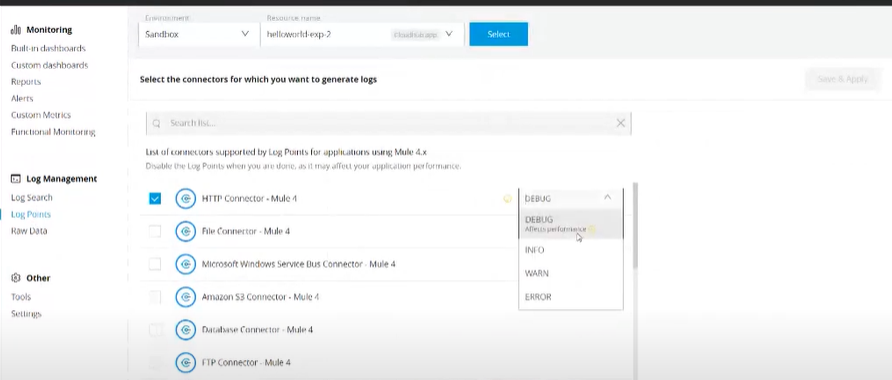
All the packages we add here will be reflected in the runtime manager.
3.3. Raw Data
Helps to download the logs of an application in our environment with date specified. Data retention depends on the subscription of our anypoint platform.
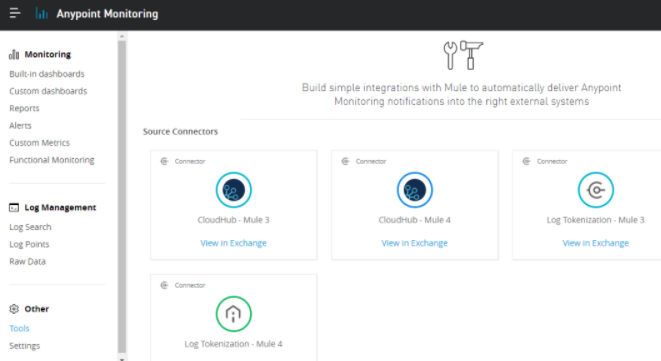
4. Tools- Titanium
This option allows external integration of logs and delivers notifications to those external systems from Anypoint monitoring. There are some built-in connectors for that as shown:
5. Built-in Dashboards- Titanium
Default dashboard by MuleSoft Anypoint platform which generally gives the status or metrics of performance of our application.
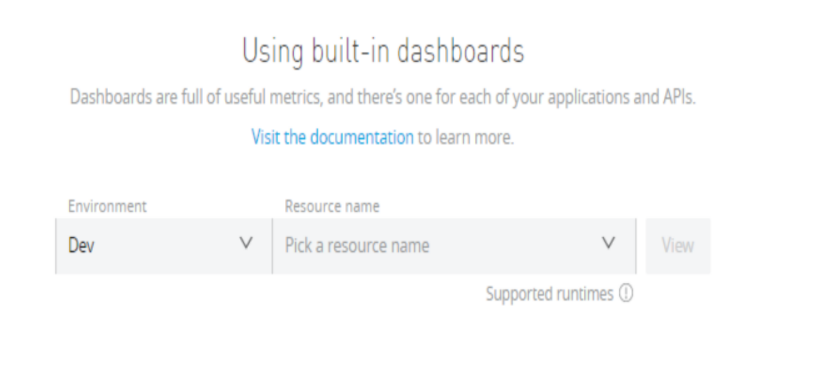
By choosing the application from our environment we get the whole statistics view in a graphical way. One example of an application is as shown below:
One example of an application is as shown below:
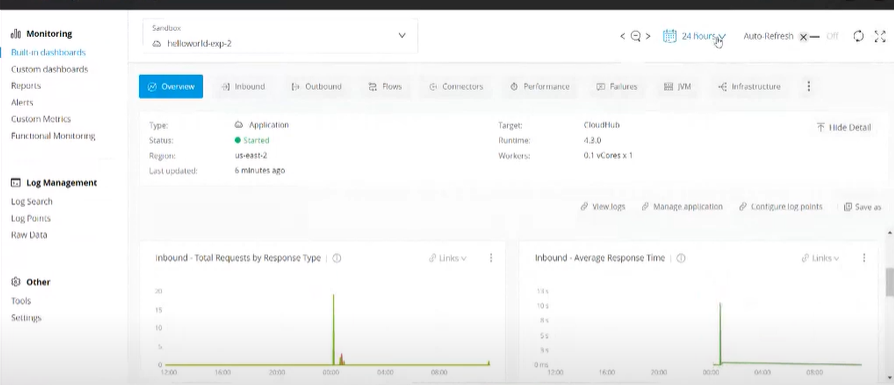
Overview gives a graphical representation of inbound and outbound responses. Inbound tab gives details of the time for responses including failed inbound responses. Outbound tab is similar to inbound tab. Similarly connectors tab shows any failure in connectors. Performance tab shows the CPU Utilization, the number of mule messages, average response time. Failure tab shows the inbound and outbound failures with respect to endpoint. Similarly the remaining tabs have features for analysing an application.
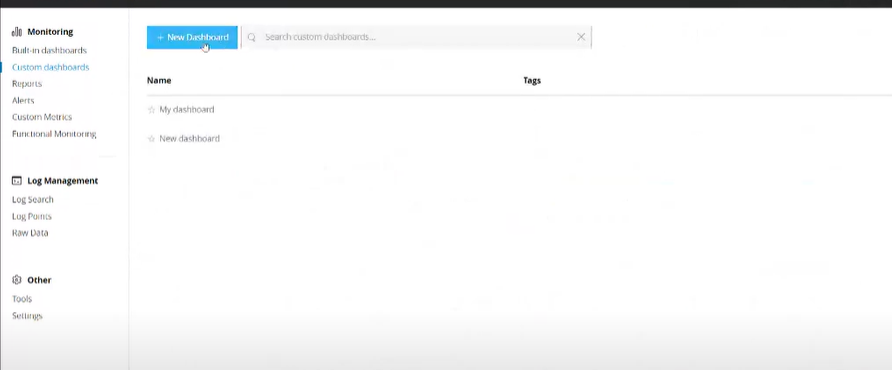
6. Custom Dashboards- Titanium
Here we create dashboards of our choice with metrics that we want to define. Creation of a custom dashboard is as shown below:
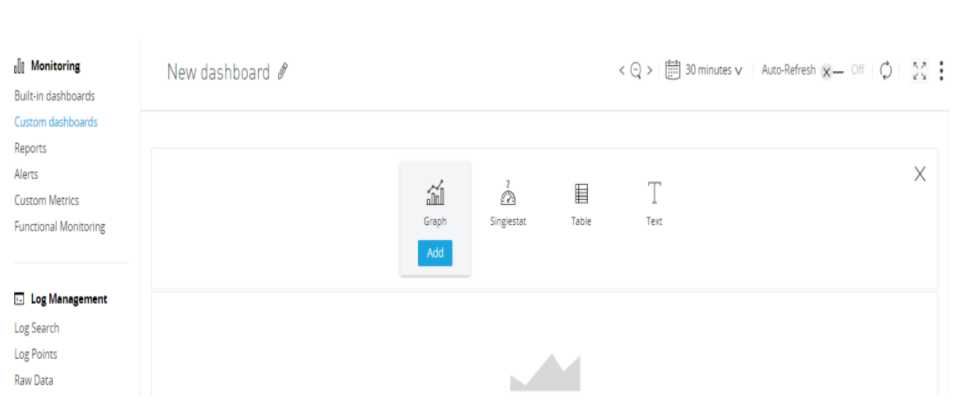
Custom dashboards allow configuration of each metrics that we want to add for a particular application.
To create a new dashboard, click on the +New Dashboard button as shown below:
You can edit the dashboard by clicking on the pencil on the top right near to the New-Dashboard.
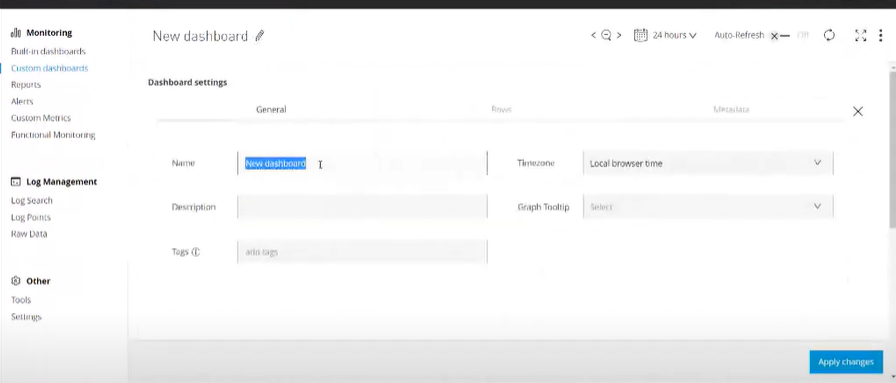
Apply changes after doing the edits. We can add whatever metrics we want to by clicking the add button:
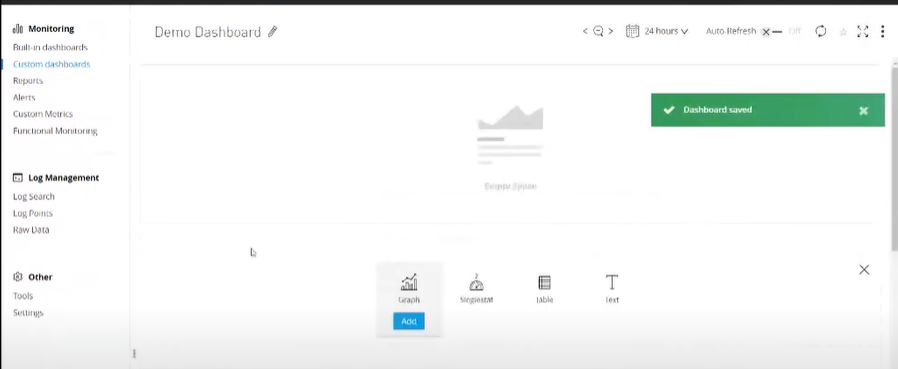
Apply changes after adding our custom metrics.
7. Alerts
We can implement any of several types of alerts. From the Alerts page in Anypoint Monitoring, you can create basic alerts, or you can link to existing alerts for API Manager and Anypoint Runtime Manager. If you have a Titanium subscription, you can also view, enable, and disable advanced alerts that are configured for graphs in custom dashboards. Alerts indicate whether a resource (such as a Mule app) is behaving as expected or exceeding a defined threshold. Alert is literally an early notification about something related to our application. There are two types of alerts for anypoint monitoring:
- Basic Alerts: Up to 50 basic alerts for users who do not have a Titanium subscription to Anypoint Platform. If you have a Titanium subscription, the limit is 100 basic alerts, and the limits increase as you purchase more vCores. An example is as given below:
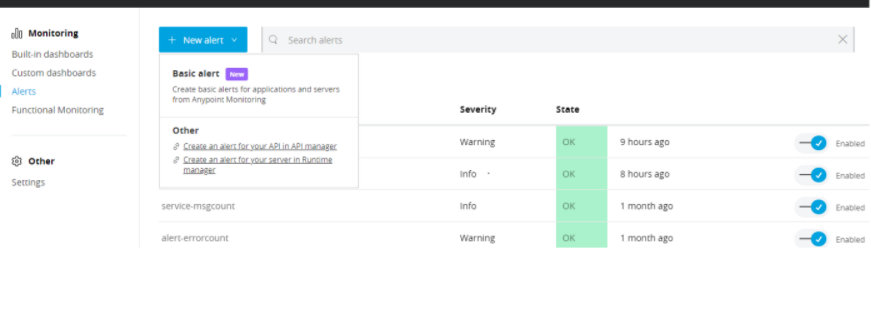
There are different states for alerts such as No data, Alerting, Disabled, OK, Pending. It also has severity levels like Info, Warning, Critical.
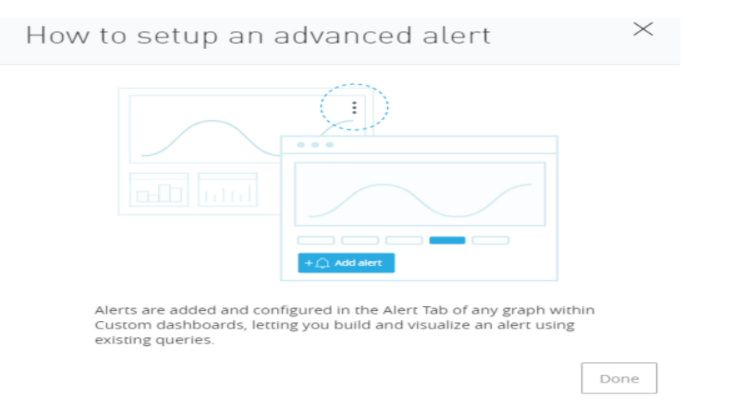
- Advanced Alerts: Limit per organisation is Up to 20 advanced alerts. Can be seen only for titanium subscription. Advanced alert is created as shown:
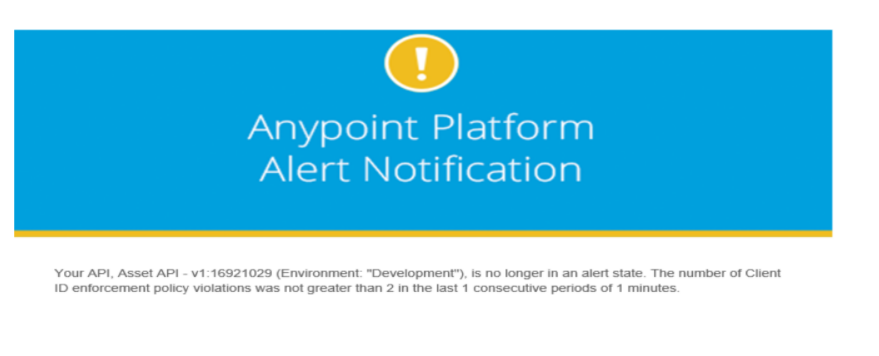
Email regarding an alert response is as shown below:
8. Anypoint Monitoring in application
There are three ways to enable MuleSoft Anypoint monitoring in our application. The first way is the to go to settings and enable Anypoint monitoring for all newly cloudhub deployed applications by giving a checkmark as shown below:
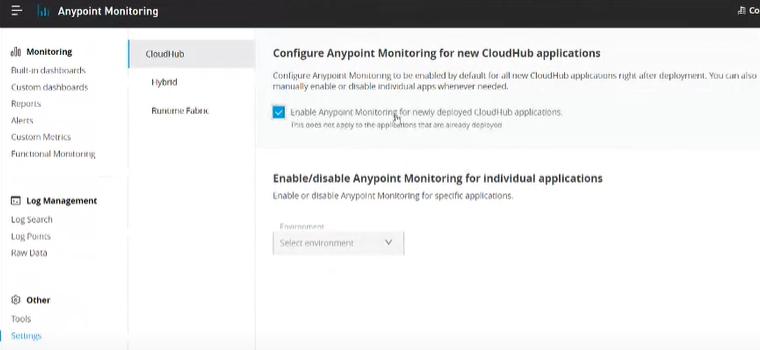
Second one is enabling /disabling anypoint monitoring for individual applications. It can be seen from the above screenshot.
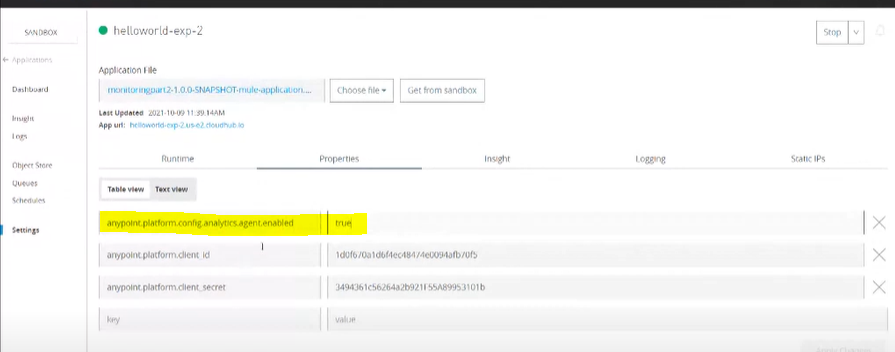
The third one is inside the runtime manager we can add as a property which is as shown below:
9. Conclusion
MuleSoft Anypoint Monitoring monitors all your APIs, integrations, and microservices in real-time — all in one place. Speed up issue identification and root-cause analysis with customizable dashboards and alerts, dependency mapping, and instant access to historical log data.
10. References